Charting and visualizing intriguing aspects of the NFL in the offseason every week, we look at the Colts offensive line, quarterback efficiency and more.
Charting various aspects of the NFL allow fans, analysts and teams alike to look at the way things are playing out on the field and better visualize the effects things have on performance. That’s why it’s always interesting to tackle every aspect of the league for every different team and see what is making them successful, where problems lie, and so forth.
This will be the first installment in a running column in which we’ll be using charts to bring up some interesting topics of discussion from around the NFL. The topics will, of course, be wide-ranging in nature.
On the docket for this column, we’ll be looking at the vaunted Indianapolis Colts offensive line, the effects of how long plays develop behind the line of scrimmage, and quarterback efficiency through our charts.
Is there a relationship between performance and time spent behind the LOS?
Running backs have different styles in the way they approach the line of scrimmage (LOS) and hit gaps. You have the likes of Le’Veon Bell, who might be considered more of a “passive” runner, as he found great success in a Steelers uniform taking his time to approach the LOS waiting for the gaps to open up for him and then hitting them with power.
We also look at the likes of Leonard Fournette, who carries more of a bulldozer style. Fournette backs his strength to throw off opponents and gain yardage, rather than waiting longer for spaces to open up in front of him.
Looking at the relationship between Rushing Yards over Expected % and the amount of time a RB spends behind the LOS. You can check out the full version here:https://t.co/Yk8kLHxvyv pic.twitter.com/et0eHxi5Rx
— Dak Brown (@_dakbrown) March 23, 2021
The above chart takes data from NFL Next Gen Stats to plot the average time a running back spent behind the LOS last season versus the percentage with which he exceeded his expected rushing yards.
To give a little more context to this calculation, Next Gen Stats takes a series of values at every play — including down-and-distance, field position, time on the clock and coordinates of defenders — and uses this to create a yardage figure that they would expect a running back to achieve on that play.
The X-axis of the graph therefore shows us how much different running backs are exceeding that expected value. The further to the right a running back is, the better performance he had in terms of yardage over the course of the season.
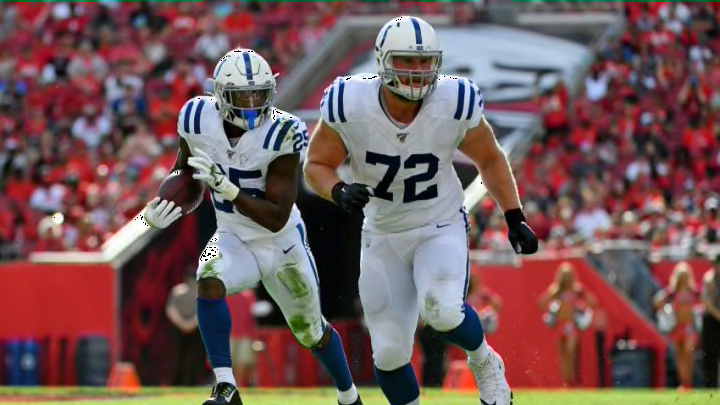
The Colts have a glaring problem with their offensive line
The Indianapolis Colts appeared to have one of the best pass blocking fronts last year. According to Team Rankings, they ranked second in fewest sacks allowed per game at 1.2. It might therefore be slightly surprising to see that PFF ranked the Indy pass block in seventh, with a grade of 72.2.
After some more digging, there are some interesting conclusions that we can infer from the data.
The #Colts have a glaring problem with their OL. #TWIC pic.twitter.com/6qP5iasLRa
— Dak Brown (@_dakbrown) March 26, 2021
The Colts had a problem last season specifically with the right hand side of their line. According to the stats, the Indy O-line plays a tale of two sides, with Anthony Castonzo and Quenton Nelson building a virtual wall to stop rushers. But on the other hand, Mark Glowinski and Braden Smith still have some work to do.
This has the potential to be a bigger issue in the future as, the more teams catch onto this weakness in the Colts offensive line, the more they will attempt to exploit and put pressure on it. Losing Castonzo could further exacerbate the issue as well.
Another study to measure the efficiency of NFL quarterbacks
Intended Air Yards vs Completed Air Yards. You can check out the full version here #TWIChttps://t.co/FbObekVMBZ pic.twitter.com/qcGDR7hNd3
— Dak Brown (@_dakbrown) March 30, 2021
The goal of the above chart is to provide an alternative measure of efficiency. The closer to the white line a quarterback is, the more efficient he is as this line represents a quarterback completing exactly the number of air yards he attempts (essentially 100 percent completion rate).
The further away from the white line the quarterback is, the more aggressive he might be in passing downfield but the more he’s missing his mark as these passes go incomplete. The further towards the right hand side, the more aggressive the passer downs the field and the left hand side represents the more conservative, yet maybe more accurate passer. Through this, we can glean which quarterbacks are both risk-takers and who succeeds in that but also who the more conservative players are and how they fare in that approach as well.
